RSI Indicator Explained: How to Use It in Forex
Trader
Quick answer: What is the RSI indicator?
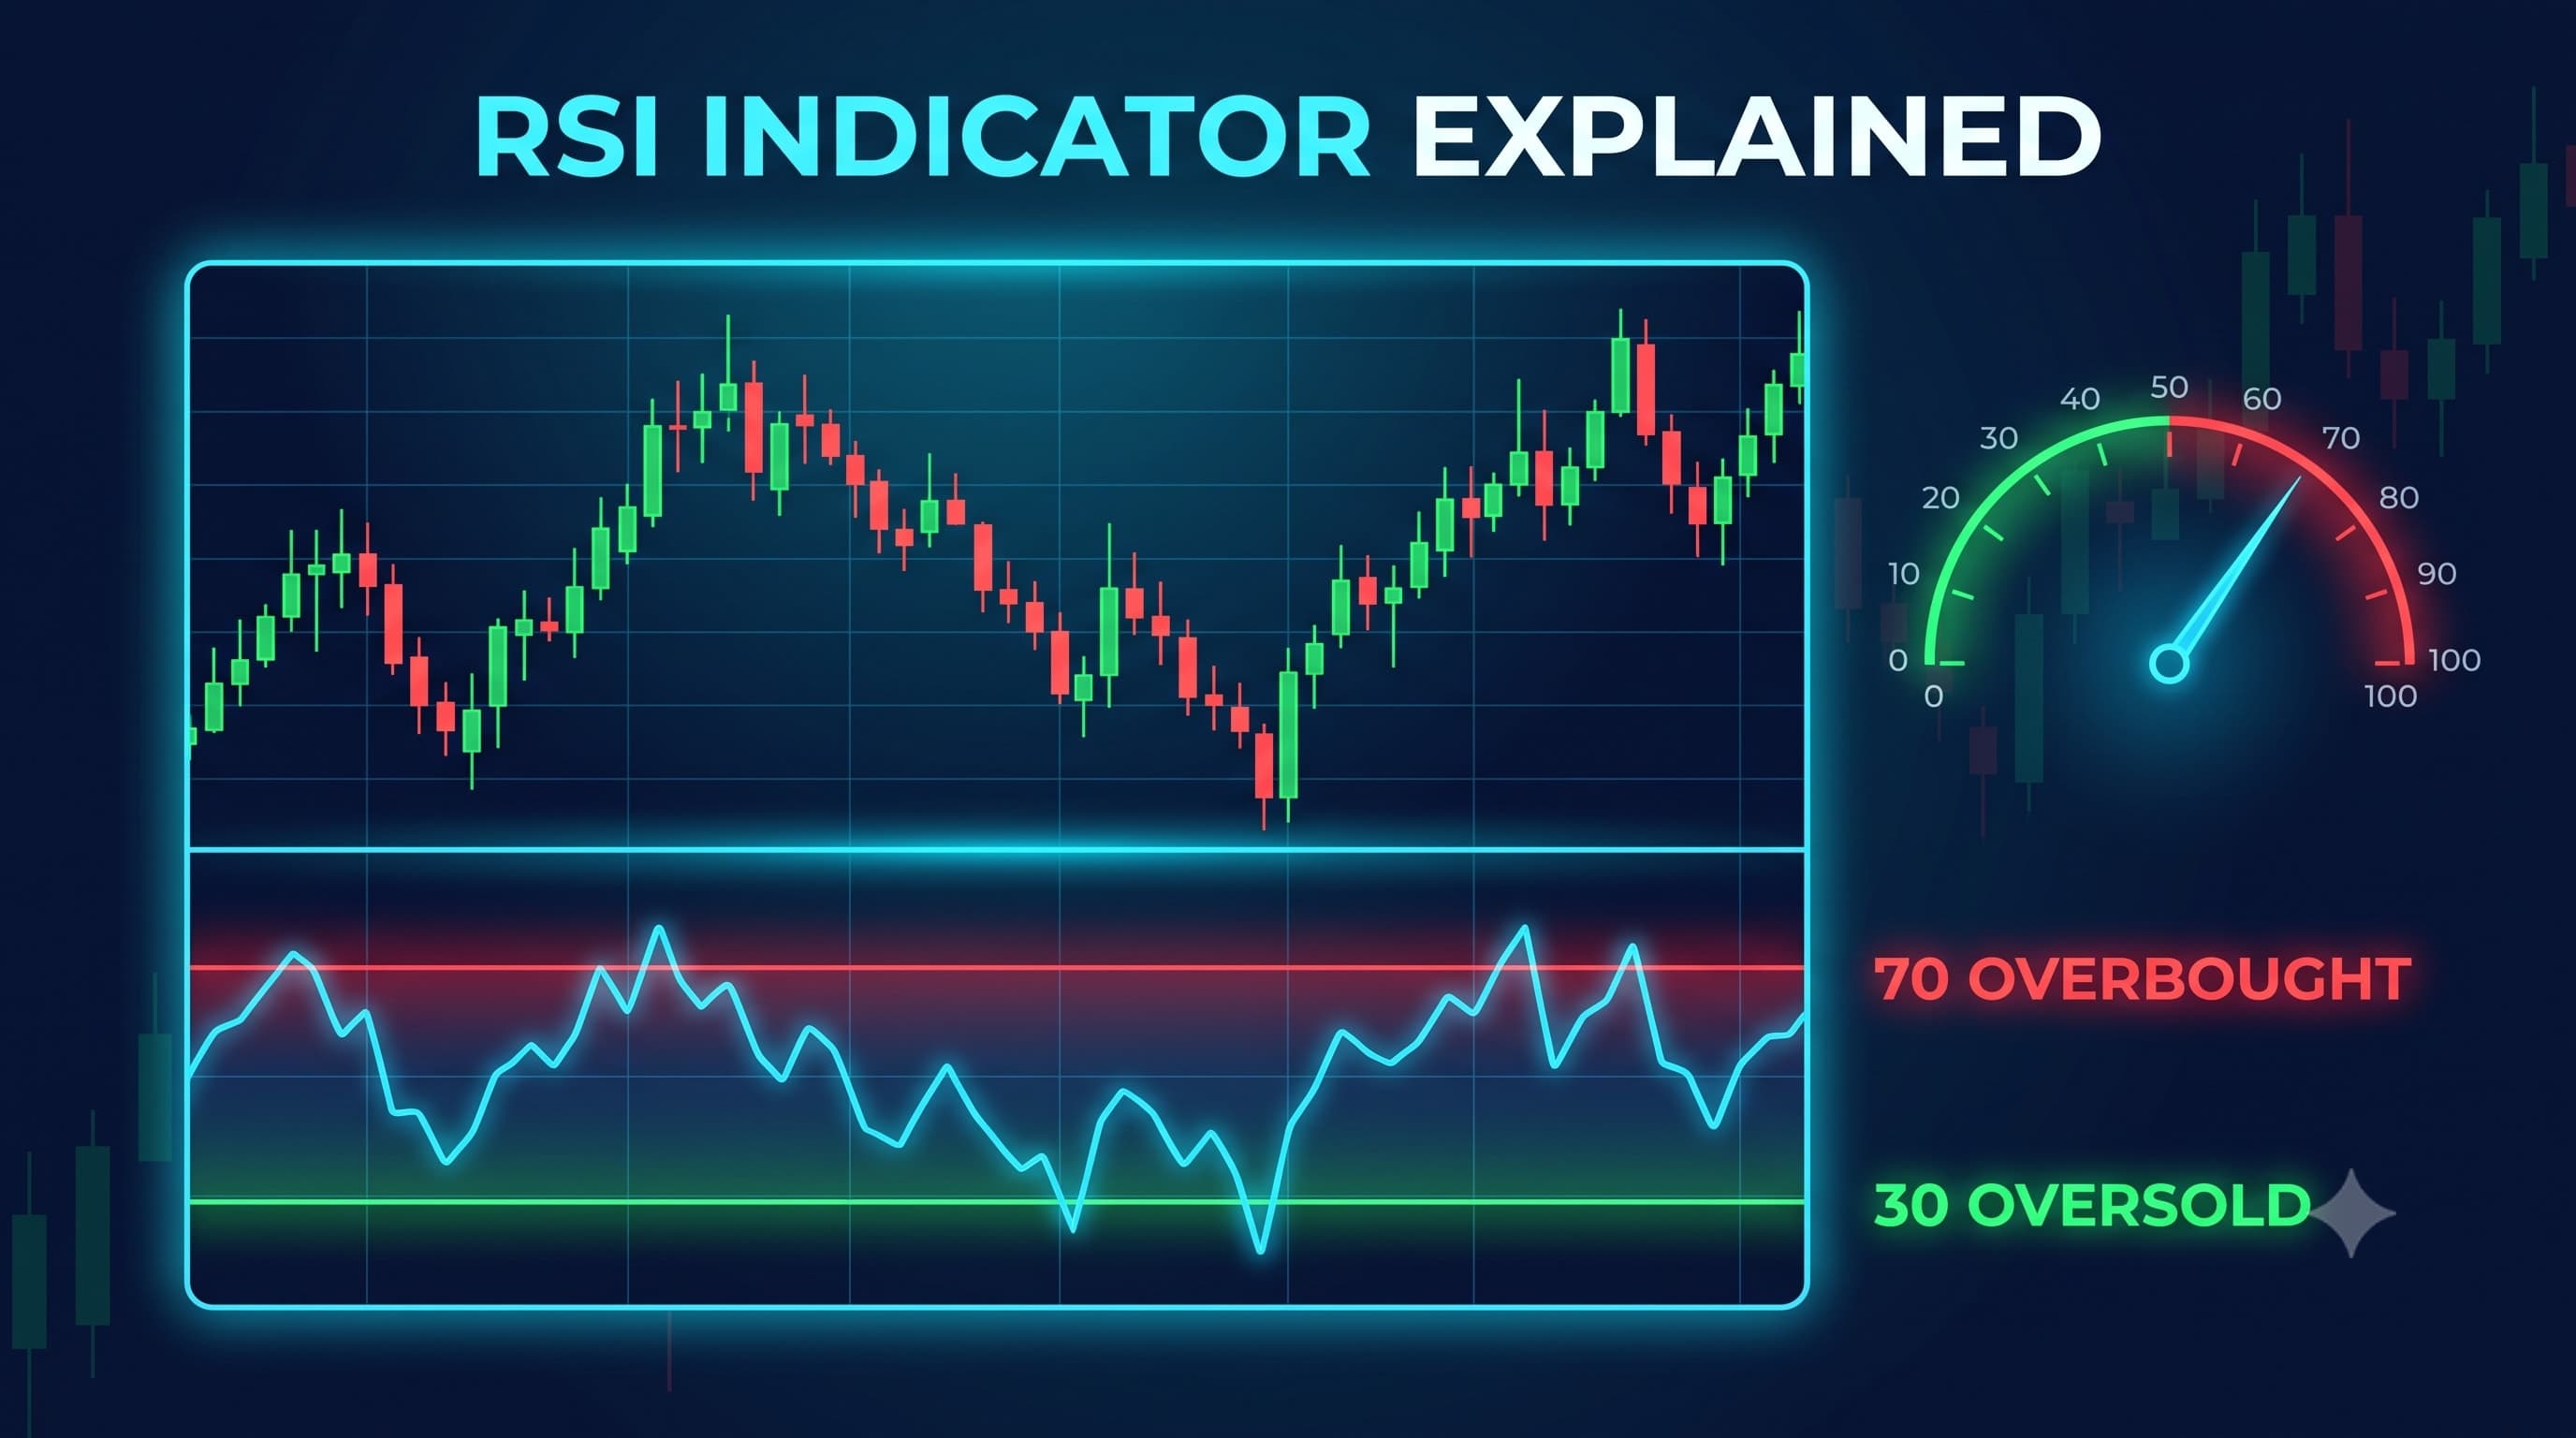
The RSI (Relative Strength Index) is a momentum indicator that measures the speed of price moves on a scale of 0 to 100. Readings above 70 are often called “overbought” and below 30 “oversold.” Traders use RSI to gauge momentum and spot potential turning points but it’s a clue, not a signal to trade blindly, and it works best with context.
Key takeaways
RSI measures momentum on a 0–100 scale.
Above 70 = often “overbought”; below 30 = often “oversold.”
“Overbought” doesn’t mean “sell now” strong trends can stay extreme.
RSI divergence can hint at a weakening trend, but needs confirmation.
How does the RSI work?
RSI compares the size of recent gains to recent losses to measure momentum. The result is plotted as a line between 0 and 100, usually below the price chart. A high RSI means price has risen strongly and quickly; a low RSI means it has fallen strongly and quickly. The default setting is 14 periods, though traders adjust it to suit their style.
What do overbought and oversold mean?
“Overbought” (RSI above 70) suggests a strong recent rise; “oversold” (RSI below 30) suggests a strong recent fall. Many beginners misread this as “overbought = sell” and “oversold = buy” but that’s a trap. In a strong trend, RSI can stay overbought or oversold for a long time while price keeps going. These levels flag momentum, not automatic reversal points.
Why “overbought” doesn’t mean “sell”
Strong trends routinely push RSI to extremes and keep going. A currency in a powerful uptrend can stay “overbought” for days or weeks. Traders who short simply because RSI hit 70 often get run over by the trend. This is why RSI works far better with the trend and alongside other tools like support and resistance than as a standalone reversal signal.
What is RSI divergence?
Divergence is when price and RSI move in opposite directions, hinting momentum is fading. For example, if price makes a higher high but RSI makes a lower high, the uptrend may be weakening even though price is still rising. Divergence is one of RSI’s more respected uses but it’s an early warning, not a guarantee, and it needs confirmation before you act.
How to use RSI sensibly
Use it with the trend, not against a strong one.
Combine it with support and resistance for context.
Watch for divergence as a warning, then wait for confirmation.
Always use a stop-loss no indicator removes risk.
Like all indicators including moving averages RSI is one input among several, not a system on its own.
The limitations of the RSI
RSI can give false signals, especially in strong trends and choppy markets. It reacts to momentum, so it can flash “overbought” long before a trend actually turns. Relying on it alone is a classic beginner mistake. Treat it as a lens on momentum, confirm with price action and levels, and manage risk on every trade.
How FXfolder helps you learn indicators
FXfolder is an educational community platform, not a signal seller, and using indicators like RSI in context is part of the education:
Educational analysis that shows how momentum tools fit a wider read.
Transparent trade history so you can study real setups.
A free Telegram community to learn alongside other traders.
Frequently asked questions
What is a good RSI setting for forex?
The default 14 period RSI is the most common starting point. Shorter settings react faster but give more false signals; longer settings are smoother but slower. Test what fits your timeframe.
Does overbought RSI mean I should sell?
Not on its own. In strong trends, RSI can stay overbought while price keeps rising. Treat overbought and oversold as momentum readings, not automatic buy or sell signals.
What is RSI divergence?
Divergence is when price and RSI move in opposite directions for example, price makes a higher high but RSI doesn’t. It can warn that a trend is weakening, but it needs confirmation.
Can I trade using only the RSI?
It’s not advisable. RSI works best combined with trend, support and resistance, and risk management. Used alone, it produces too many false signals, especially in trending markets.
The bottom line
The RSI is a momentum indicator that measures how fast price is moving, flagging overbought and oversold conditions and hinting at divergence. But “overbought” isn’t “sell,” and RSI can stay extreme in strong trends. Use it with the trend, confirm with other tools, and always manage risk.
Learn indicators with a community: Join FXfolder’s free Telegram channel for educational, transparent trade ideas.
Risk disclaimer: Forex trading involves substantial risk of loss and is not suitable for every investor. All content on FXfolder is for educational purposes only and does not constitute financial, investment, or trading advice. Past performance is not indicative of future results. Always do your own research and consider your risk tolerance before trading.
Educational content only. Not investment advice.